MiSCUG – Using Power BI to Report OS Deployment Stats
On 11 January 2019 I had the privilege to speak at the Michigan System Center Users Group meeting on the topic of using Power BI to report your OSD build stats. This is a companion post to that presentation.
This is an update to my original post ( here ) on how to gather and present statistics on your build sequences. I’ve taken what I’ve learned since that original post and have expanded the process to handle not only an OSD “build” but also a WaaS CompatScan or In-Place Upgrade, or any other Task Sequence.
For those that are interested I have recordings of the presentation available on YouTube.
MiSCUG Practice – Using Power BI to Report OS Deployment Stats – This recording is the best of my practice attempts.
MiSCUG Presentation – Using Power BI to Report OS Deployment Stats [11-Jan-2019] – This recording is the actual presentation from the MiSCUG meeting.
Why would we want to do this?
If you are responsible for maintaining the OS Deployment Task Sequences (the “builds”) in your environment then at some point you have most likely been challenged on:
- Why does the build take so long?
- Why does the build fail so often?
- What are the most common failures?
After spending too much time reactively addressing these and other similar questions I decided to take a more proactive approach. I started collecting data at the completion of the builds and compiling it, ultimately with Power BI.
There are various ways you can achieve the end results. You can query directly against the Configuration Manager database, and there are several Power BI dashboards available to do just that. For example, Jordan Benzing has a real nice OSD dashboard that does exactly that here.
You could write the data to the Registry, or a custom WMI class and gather it with Configuration Manager and use Power BI to query that. When I started this though, I was not using Power BI. In fact, I originally had never heard of Power BI and was using Pivot Tables and charts in Excel.
I opted for a simple solution, gathering the data important to me at the completion of a build and sending it to CSV files on a server. I have full control over what is collected and can use any reporting tool capable of leveraging CSVs as a data source if needed. I started with Excel and moved to Tableau before settling on Power BI.
Okay, so then how do we collect the data?
The first thing you are going to want to do is decide what is important to you. Collecting build start and finish times so you can calculate build times is simple enough. Controlling and capturing task sequence failures is needed to report on success/failure rates.
What else?
This process uses task sequence variables. We use them all the time in our sequences, whether they are the native variables or custom variables we create. In fact, if you have actions in your sequences that rely on custom variables that you have created, those might also be key data points to collect.
For example, say you have a front-end that acts as a wizard for the build tech and offers various options to control the build. Maybe they have the option to use USMT to migrate the user’s data. Or perhaps you have remote locations where you need to leverage some sort of peer-to-peer technology like 1E’s NomadBranch and there are actions in your build that determine if a machine is building in one of these remote locations.
Once you have decided what data is important to you then it is time to figure out how to go about collecting it.
My Example
To illustrate I’ll use the following scenario as an example:
- My environment has a main location and multiple remote sites
- I have the following servers:
- DC01 – Windows Domain Controller
- CM01 – Configuration Manager (CB)
- FS01 – Basic File Server
- I use a UI++ front-end where techs can select if USMT is used to backup and/or restore the user data
The task sequence, data gathering script, sample data CSVs as well as the Power BI report are all available in my GitHub repository located here.
Data Selection (The “What”)
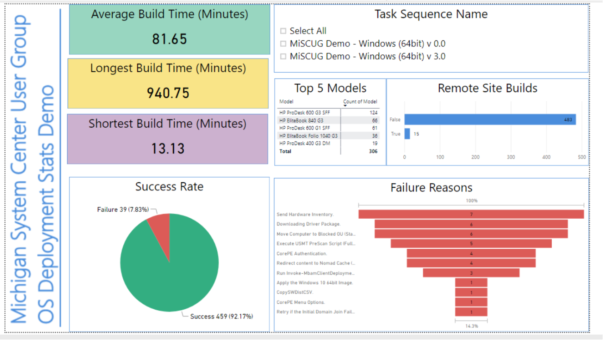
I want to be able to show build success rates, build times, number of builds in remote sites, how often USMT is used, models being built, in the case of a failure the reason for the failure and a breakdown showing build counts per day.
So, I will need to collect variables for the following:
- Success/Failure of the build
- Build times / Builds per day
- Start date and time
- End date and time
- Remote vs. Main site
- USMT selection
- Model
- Failure reason
In addition, I will also collect the computer name and the task sequence ID and name being used.
Server/Share Setup (The “Where”)
You will need to have a location to centralize the collection of the data. I’ve hung a share off my file server (FS01). There are no complex requirements for the share, you just need to grant an account permission to write to the location. This same account will be used to connect to the share within the task sequence.
Data Gathering (The “How”)
Now that I know the “what” that I want to collect and the “where” I want to store it, the last step is the “how”. We’re going to need to make some modifications to the build sequence and add a script to do the heavy lifting.
Task Sequence
I’m using a basic OSD build sequence with a few additions, but in general the heart of the sequence is a native ConfigMgr OSD sequence.
The first thing we want to do is to structure our sequence so that we can catch failures and control the exiting of the task sequence.
You don’t want to end up with this:

There are several ways to do this, but I prefer the method that Adam Gross came up with. His logic works much better than the method I have been using for years. You can find the details in his blog posts:
Building a Better Task Sequence (A Square Dozen)
Building an Even Better Task Sequence (A Square Dozen)
His method uses the Try/Catch/Finally logic used in scripting and applies it at the task sequence level.
Here is the key structure of my sequence:

Set Variables
Here I set 3 task sequence variables.
Set TS Variable (OSDVer)
OSDVer contains the version of the task sequence (i.e. 1.0, 2.5, 5.0, etc.) and is used by the script to keep the results from different versions of the sequence separated.
Set TS Variable (OSDBranch)
OSDBranch is a variable I use to identify what stage the sequence is currently (i.e. DEV/QA/PILOT/PROD). The script will use this to keep results from Development builds from skewing results from Production builds.
Record Build Start Time (PoSh)
This is a PowerShell one-liner that creates a variable that contains the starting date and time of the sequence. Essentially starting the stopwatch.
[powershell (New-Object -COMObject Microsoft.SMS.TSEnvironment).Value(‘OSDStartInfo’) = (Get-Date -Format dd-MMM-yyyy’ ‘HH:mm:ss)]
Failure Group
This group of actions are only executed should there be a failure within the build sequence (_SMSTSLastActionSucceeded = False). In this example there are only 2 actions performed.
The first uses a Dynamic Variables action to identify the return code of the failed step (_SMSTSLastActionRetCode) and the name of the failed step (_SMSTSLastActionName). It also sets the “AllStepsSucceeded” variable to “False” so we do not accidentally stumble in the “Success Group”.
The second action sets a variable named “OSDResults” to “Failure”. The collection script will use this variable to record if the build was successful or a failure.
Success Group
This group will only execute should the entire task sequence complete successfully (AllStepsSuceeded = True).
The first action performed is to set the OSDResults variable to “Success”.
The second action sets the machine to reboot at the end of the sequence.
Cleanup and Logging Group
Regardless of success or failure, the last group will be executed. The purpose of this group is to connect to the logging share on the file server (FS01), execute the PowerShell script that collects the results data, and then disconnect from the server.
PowerShell Script
The PowerShell script that does the work of collecting the data and writing it out to the CSV file is relatively simple. It pulls in the required variables, calculates the elapsed runtime in minutes and used WMI to query the computer model. This is all then written to the CSV file on the server.
The script will take the variables set at the beginning of the task sequence to construct the path and filename of the CSV to write to.
In my example it would work out to:
\FS01\MiSCUG\BuildStats\Demo\OSDResultsTally_3.0.csv
- OSDResultsShare = \\FS01\MiSCUG
- OSDBranch = Demo
- OSDVer = 3.0
Below are a few highlights of how the script is operating. The full script is available here from my GitHub repository.
# Start of Code
# Set Variables
# Script Variables
$myScript = "OSDResults"
$MyVersion  = "1.0"
# Task Sequence Variables
$tsenv = New-Object -COMObject Microsoft.SMS.TSEnvironment
$OSDVer = $tsenv.Value("OSDVer")
$TargetFolder = $tsenv.Value("OSDResultsShare")
$OSDBranch = $tsenv.Value("OSDBranch")
# Logging Variables
$CSVfileName = "OSDResultsTally_$OSDVer.csv"
$OutPut = "$TargetFolder\BuildStats\$OSDBranch"
$CSVFile = "$OutPut\$CSVfileName"
The elapsed time is calculated in minutes:
# Start Date/Time
$OSDStartInfo   = $tsenv.Value("OSDStartInfo")
# Finish Date/Time
$OSDFinishInfo = (Get-Date -Format "dd-MMM-yyyy HH:mm:ss")

# Elapsed time
$TimeDiff = New-TimeSpan -Start $OSDStartInfo -End $OSDFinishInfo

# Break the elapsed time down into units
$Days = $TimeDiff.Days
$Hrs = $TimeDiff.Hours
$Mins = $TimeDiff.Minutes
$Sec = $TimeDiff.Seconds

# Boil it all down into the number of minutes the build took
# Days (just in case)
IF ($Days -gt 0) {$dMins = ($Days * 24) * 60}
# Hours
IF ($Hrs -gt 0) {$hMins = $Hrs * 60}
# Seconds into a fraction of a minute
$mSec = $Sec / 60

# Limit to 2 decimal places
$mSec = "{0:N2}" -f $mSec

# Add it all up to get the number of minutes the build took
$ElapsedTime = $TimeDiff.TotalMinutes
$ElapsedTime = "{0:N2}" -f $ElapsedTime
$ElapsedTime = $ElapsedTime -replace '[,]'
Everything is bundled up and written to a CSV file on the server.
# Data Write
Add-Content -Value "$CompName,$OSDStartInfo,$OSDFinishInfo,$ElapsedTime,$OSDModelInfo,$TSID,$TSName,$OSDResults,$SmstFailAction,$OSSlowSiteInfo,$USMTBackup,$USMTRestore" -Path $CSVFile
Now, you can run a few builds to generate some data, or you can download a sample CSV file that I generated with data for roughly 500 builds ( Sample CSV ).
I Have Data, Now What?
Now that you have some data to work with, either from some test builds or the sample CSV, you can now pull it into Power BI.
I won’t go into the details of installing Power BI Desktop. You can find the download as well as more information here on Microsoft’s Power BI site.
Open Power BI Desktop. If you have never used Power BI before you will see the following splash screen. You can simply click the “X” in the upper right corner to clear it.

You will then have the Power BI interface.

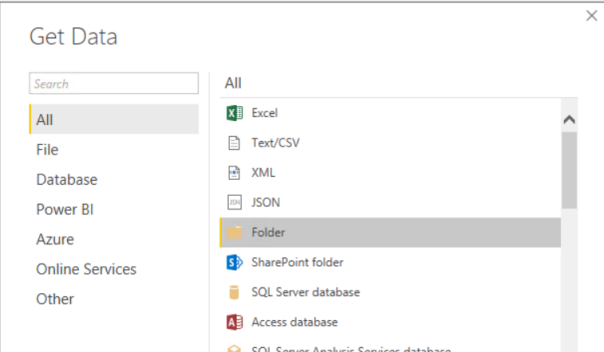
The first thing you need to do it pull in the data that you have collected. To do this click the “Get Data” button on the Ribbon.

Now, one of the cool things about Power BI, besides a wide variety of data source options, is that you can point it to a folder and Power BI will natively consolidate the files it finds in that folder. Then as new files are added, or existing files are modified those changes are automatically picked up in your report when refreshed.
So we are going to select the “Folder” option for our data source and browse to the folder on the fileserver that holds our sample data CSVs.
After browsing to the folder on the file server, Power BI will first display the files that it found in the specified folder. This allows you to spot any errant files that may have been in that folder and remove them before they are processed.
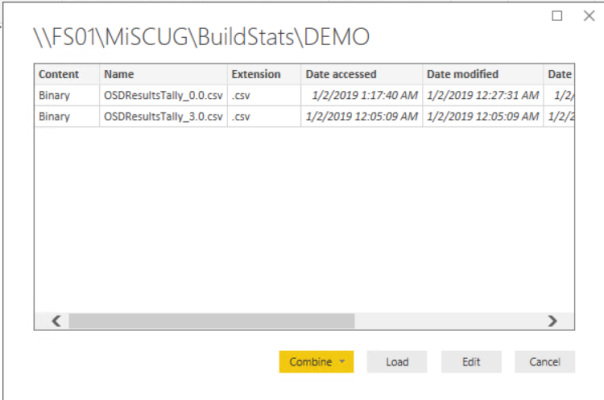
All looks good so we’ll click the “Combine” button and select the option to “Combine & Load”. This will instruct Power BI to consolidate the files it found. It will then present a table showing what it consolidated. This is another opportunity to double-check that what Power BI is presenting matches what you were expecting.

If everything looks as you expected it to, click “OK”. Power BI will then generate a consolidated table and present you will the fields corresponding to the column headings.
In the Power BI console you should now see a list of fields in the far right panel.

At this point, everything is a matter of clicking and dragging. We’ll get things started with Pie Chart showing the success rate.
First, click on the Pie Chart icon in the “VISUALIZATIONS” pane.

This will create an empty pie chart in the display. You can click and drag to resize and reposition it. Under the “VISUALIZATIONS” pane you will have a number of fields to populate.

Drag the “OSDResults” from the field list to the “Legend” field and again to the “Values” field.

If you click the icon that looks like a paint roller, you will have access to the controls to customize the Pie Chart, things like chart colors, labels, titles, text settings, etc.
With a little bit of toying around and practice you can create something like this using the sample data:
Everything referenced here is available at my GitHub repository for the Michigan System Center User Group presentations here.

- MiSCUG – Demo Power BI Report.pbix
- Demo Power BI report
- MiSCUG_20190111 v 3.0.zip
- Sample task sequence used in the demo
- OSDResultsTally.ps1
- PowerShell script for gathering and uploading OSD build data
- OSDResultsTally_0.0.csv
- Sample data generated for use in demo Power BI reports
With the Power BI report published to our SharePoint site there is never any question or debate about how long the build takes or how often it fails.
Thanks and good luck!
Posted on January 14, 2019, in Configuration Manager, Handy to Have, OSD, Power BI, PowerShell, SCCM, Task Sequences, Windows 10 and tagged Configuration Manager, Lab, OSD, Power BI, PowerShell, System Center Configuration Manager, Tableau, Task Sequence, Windows 10. Bookmark the permalink. Leave a comment.

Leave a comment
Comments 0